As ever, there have been a few industry reports, such as one by myhome.ie, which understandably focuses on the upbeat news that the number of transactions and their value are up on the corresponding period in 2013. On its website, myhome.ie provides fine detail on how asking prices are up pretty much everywhere in the Republic.
Given such fine detail, it is surprising (or not really) that such surveys rarely focus on "average" prices actually fetched when properties were sold, especially in 2014 when it seems the green shoots of a new bubble (excuse the mixed metaphor) seem set to grab the nation again.
Why not? Because the figures are nowhere near as positive as the sector would like us to believe? Surely not.
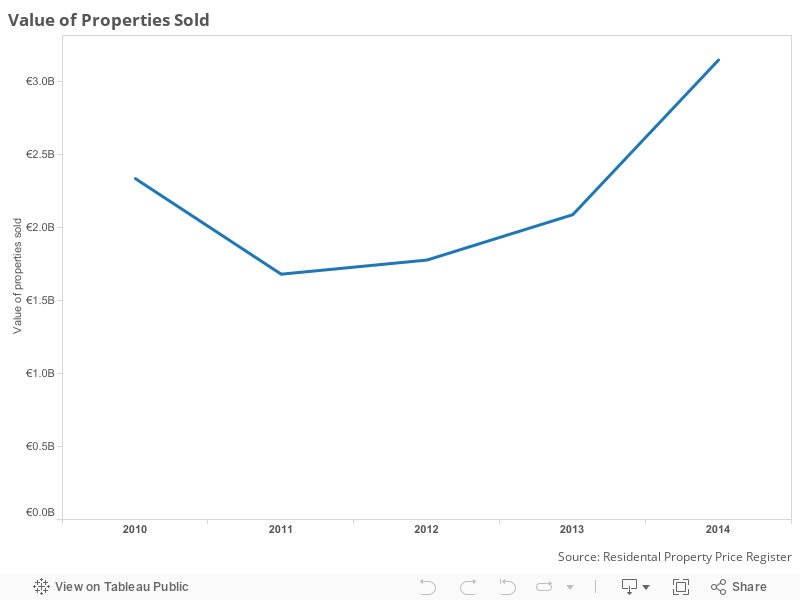
All the following figures and graphs are derived from the Residential Property Price Register which records all residential sales in the Republic.
I've excluded all non-full price transactions from the records which can sometimes comprise about 5% of all sales. However, their exclusion should not distort the picture either nationally or at county level to any extent and helps to provide a more accurate figure in relation to property prices. For the same reason, I've added 13.5% to all the prices recorded in the Register for new homes as they are exclusive of VAT. The inclusion of the VAT element provide a better reflection of the true cost of property to buyers.
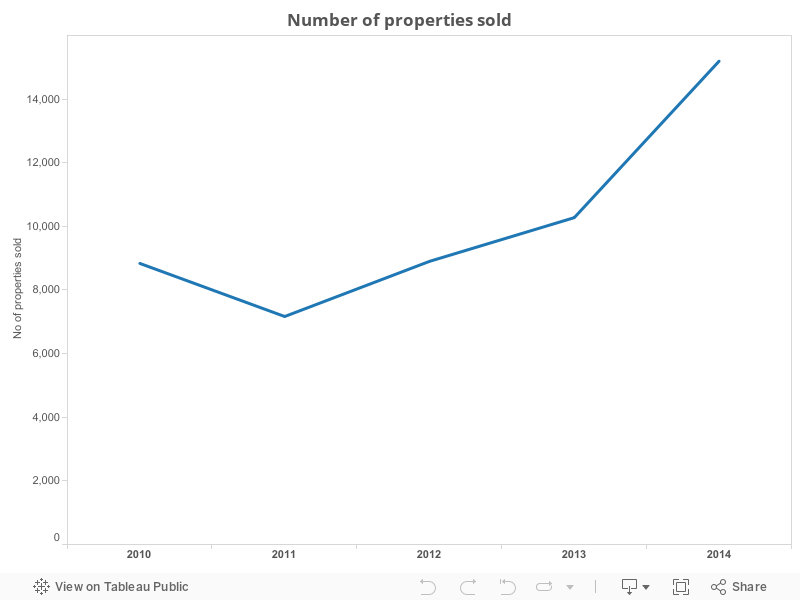
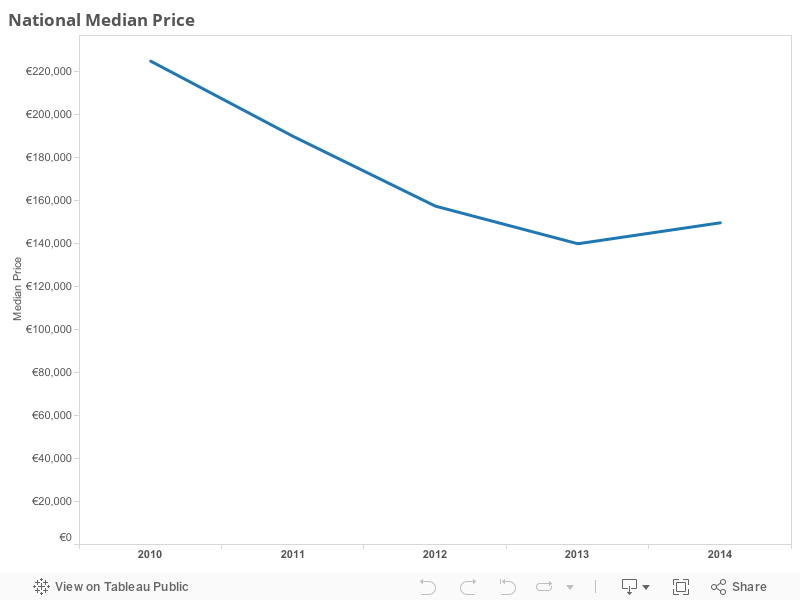
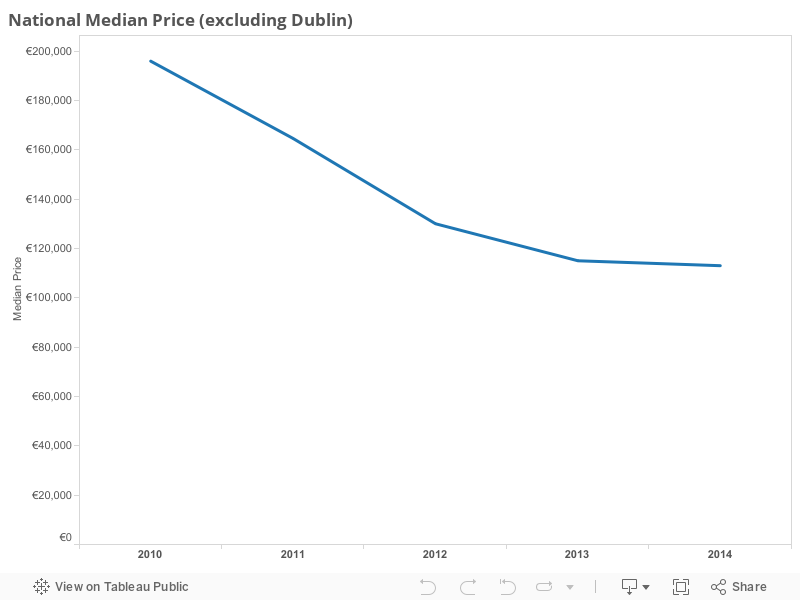
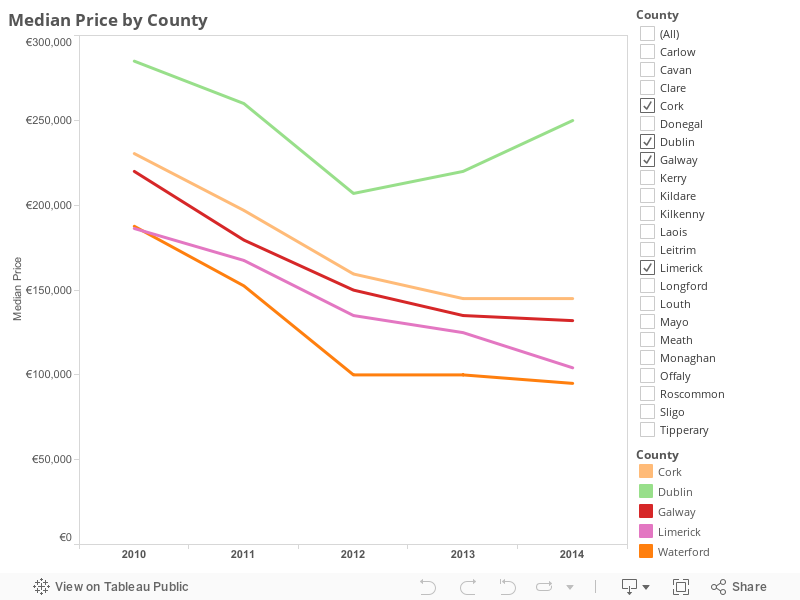
The RPPR while limited in lots of respects provides us with three of the most important pieces of information about the market - the number of properties sold in any period, their value and "average" prices. The best measure of what most people label "average" prices is the median price - the figure which provides the mid-value of all prices within a specific range. It provides a truer picture of what most people are paying for property as it eliminates the distorting effect that a particularly expensive or cheap property would have on the calculation of the traditional average - i.e total value of all properties/ total count of all properties.First of all - how much business is being transacted?
No comments:
Post a Comment